A year in one canvas
Canvas
You will buildA picture of the whole year 2027 on the Overview: 365 small squares in one Canvas, a column for each week, the days away in the highlight color and the months named along the top — and a label that tells VoiceOver what the picture shows.
TimeAbout 50 minutes
WhyEvery view in SwiftUI is cheap, but not free: each has identity, layout and accessibility, and a few hundred of them for one picture is a lot of machinery for squares that never move or answer a tap. A Canvas is the other way to draw — you are handed a drawing context and a size, and you draw, as with Core Graphics, with no view per thing drawn. Interviewers ask when to choose it, and what you give up when you do.
Open your project
Open your
Tripsproject as lesson 26 left it: double-clickTrips.xcodeprojin Finder, or use File ▸ Open… (⌘O) in Xcode.If you did not finish lesson 26, or would rather start from a known state, download Trips-lesson-26.zip instead. It is the project exactly as it stood at the end of lesson 26. Unzip it and open
Trips.xcodeproj.Run it (⌘R) to check that it builds. You should see where lesson 26 ended:
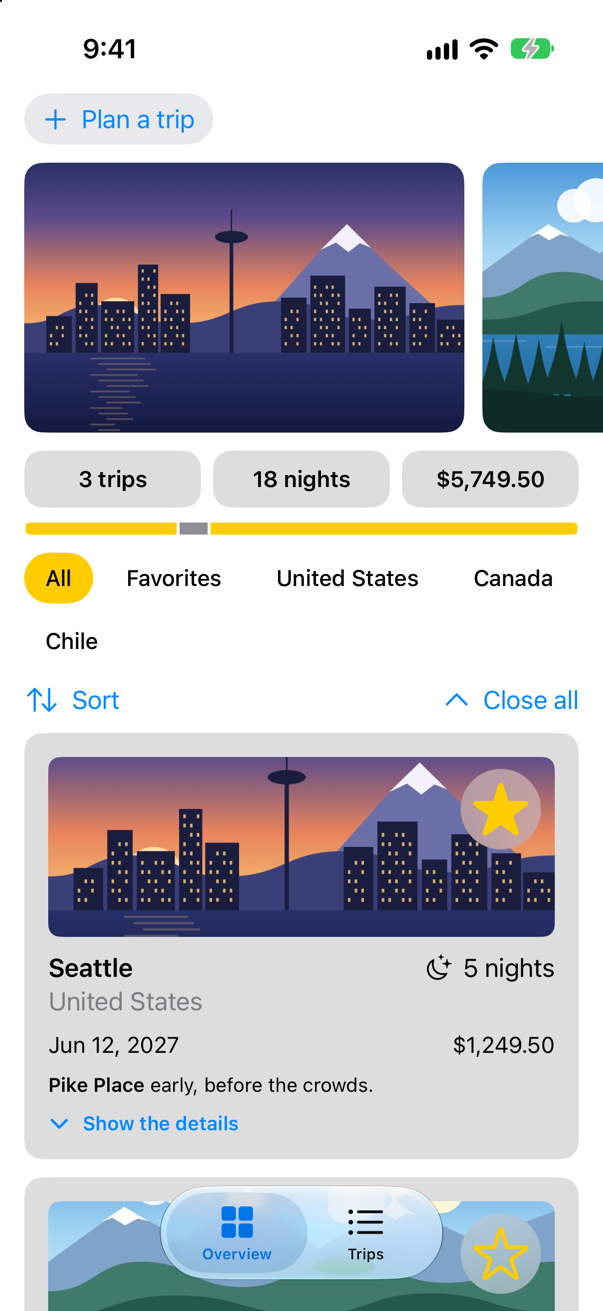
Trips, as it stood at the end of lesson 26Screenshot · iPhone 17, iOS 27.0
A canvas of every day
A Canvas takes one closure, which SwiftUI calls whenever the canvas must be drawn, passing a GraphicsContext — the drawing surface and its settings — and the size to fill. Inside, you draw with commands: context.fill(path, with: .color(...)) fills a path. Apple calls it "immediate mode drawing". Here the closure draws a rounded square for each day of 2027, in columns of seven: the slot a day falls in is its number plus the weekday January 1 falls on, its column slot / 7 and its row slot % 7. Make a SwiftUI View named YearGrid:
struct YearGrid: View { let trips: [Trip] var year = 2027 var body: some View { Text("Hello, World!") Canvas { context, size in let step = size.width / 53 let firstRow = Calendar.current.component(.weekday, from: Date.on(year, 1, 1)) - 1 for day in 0..<daysInYear { let slot = day + firstRow let square = CGRect(x: Double(slot / 7) * step, y: Double(slot % 7) * step, width: step - 1.5, height: step - 1.5) context.fill(Path(roundedRect: square, cornerRadius: 1.5), with: .color(.gray.opacity(0.25))) } } .frame(height: 60) .padding(.horizontal) } /// How many days the year has: 365, or 366 in a leap year. private var daysInYear: Int { Calendar.current.range(of: .day, in: .year, for: Date.on(year, 1, 1))!.count }}struct YearGrid: View {
let trips: [Trip]
var year = 2027
var body: some View {
Canvas { context, size in
let step = size.width / 53
let firstRow = Calendar.current.component(.weekday, from: Date.on(year, 1, 1)) - 1
for day in 0..<daysInYear {
let slot = day + firstRow
let square = CGRect(x: Double(slot / 7) * step, y: Double(slot % 7) * step,
width: step - 1.5, height: step - 1.5)
context.fill(Path(roundedRect: square, cornerRadius: 1.5), with: .color(.gray.opacity(0.25)))
}
}
.frame(height: 60)
.padding(.horizontal)
}
/// How many days the year has: 365, or 366 in a leap year.
private var daysInYear: Int {
Calendar.current.range(of: .day, in: .year, for: Date.on(year, 1, 1))!.count
}
}#Preview { YearGrid() YearGrid(trips: Trip.samples)}#Preview {
YearGrid(trips: Trip.samples)
}And show it on the Overview, under the summary. In ContentView.swift:
struct ContentView: View { @Environment(TripStore.self) private var store @State private var filter = TripFilter.all @State private var closings = 0 var body: some View { @Bindable var store = store ScrollView { LazyVStack(spacing: 12) { TripPlanner() .environment(\.highlight, .mint) PhotoStrip(trips: store.trips) TripSummary(trips: store.trips) YearGrid(trips: store.trips) FilterBar(filters: filters, selection: $filter) .frame(maxWidth: .infinity, alignment: .leading) .padding(.horizontal) HStack { Menu("Sort", systemImage: "arrow.up.arrow.down") { Button("By date") { store.trips.sort { $0.start < $1.start } } Button("By price") { store.trips.sort { $0.price < $1.price } } } Spacer() Button("Close all", systemImage: "chevron.up") { closings += 1 } } .padding(.horizontal) LazyVGrid(columns: [GridItem(.adaptive(minimum: 300))], spacing: 12) { ForEach($store.trips) { $trip in if filter.includes(trip) { TripCard(trip: $trip) } } } .id(closings) } } } /// All, Favorites, and then a filter for each country that has a trip. private var filters: [TripFilter] { var countries: [String] = [] for trip in store.trips where !countries.contains(trip.country) { countries.append(trip.country) } return [.all, .favorites] + countries.map { TripFilter.country($0) } }}struct ContentView: View {
@Environment(TripStore.self) private var store
@State private var filter = TripFilter.all
@State private var closings = 0
var body: some View {
@Bindable var store = store
ScrollView {
LazyVStack(spacing: 12) {
TripPlanner()
.environment(\.highlight, .mint)
PhotoStrip(trips: store.trips)
TripSummary(trips: store.trips)
YearGrid(trips: store.trips)
FilterBar(filters: filters, selection: $filter)
.frame(maxWidth: .infinity, alignment: .leading)
.padding(.horizontal)
HStack {
Menu("Sort", systemImage: "arrow.up.arrow.down") {
Button("By date") { store.trips.sort { $0.start < $1.start } }
Button("By price") { store.trips.sort { $0.price < $1.price } }
}
Spacer()
Button("Close all", systemImage: "chevron.up") { closings += 1 }
}
.padding(.horizontal)
LazyVGrid(columns: [GridItem(.adaptive(minimum: 300))], spacing: 12) {
ForEach($store.trips) { $trip in
if filter.includes(trip) {
TripCard(trip: $trip)
}
}
}
.id(closings)
}
}
}
/// All, Favorites, and then a filter for each country that has a trip.
private var filters: [TripFilter] {
var countries: [String] = []
for trip in store.trips where !countries.contains(trip.country) {
countries.append(trip.country)
}
return [.all, .favorites] + countries.map { TripFilter.country($0) }
}
}Run the app:
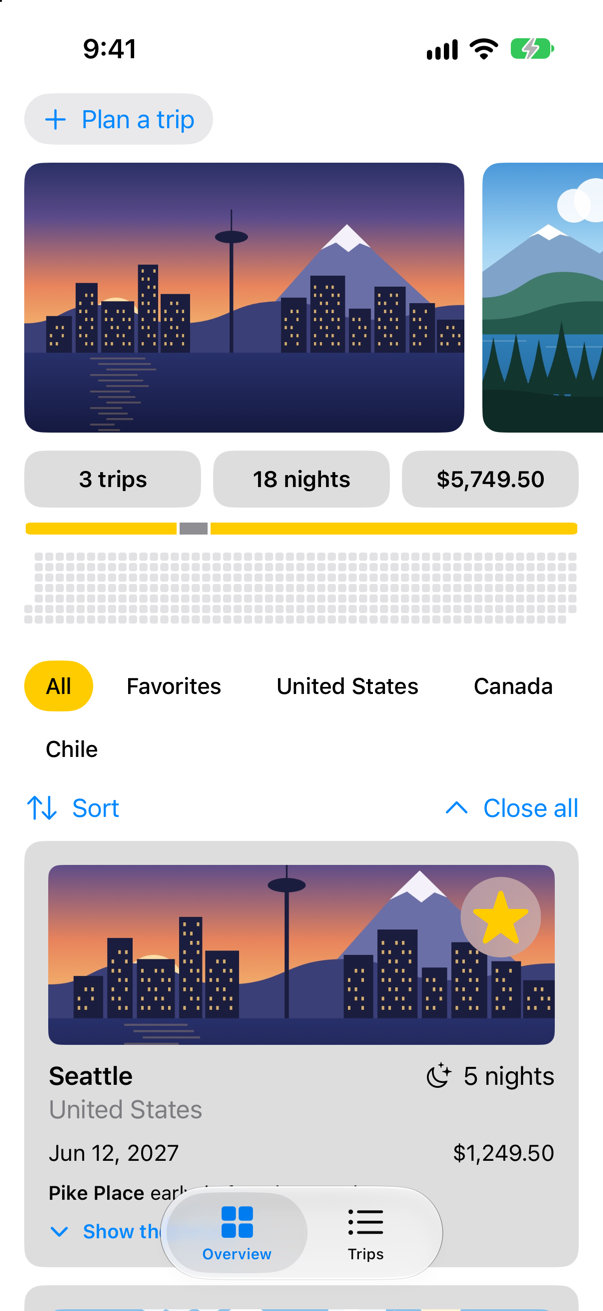
A year of squares under the summary — and not one of them is a view. The canvas is one view; the squares are paint. Apple puts the trade plainly: "A canvas doesn’t offer interactivity or accessibility for individual elements … However, it might provide better performance for a complex drawing that involves dynamic data."
The days away, in color
A trip is under way from its first day for as many days as it has nights. awayDays turns every trip into the day numbers it covers, and the canvas fills those squares with the highlight color. Note where the set is made: once, before the loop, as let away = awayDays. Inside the loop it would be computed again for each of the 365 squares — the drawing closure is ordinary code, and runs exactly as written. In YearGrid.swift:
struct YearGrid: View { let trips: [Trip] var year = 2027 @Environment(\.highlight) private var highlight var body: some View { Canvas { context, size in let step = size.width / 53 let firstRow = Calendar.current.component(.weekday, from: Date.on(year, 1, 1)) - 1 let away = awayDays for day in 0..<daysInYear { let slot = day + firstRow let square = CGRect(x: Double(slot / 7) * step, y: Double(slot % 7) * step, width: step - 1.5, height: step - 1.5) context.fill(Path(roundedRect: square, cornerRadius: 1.5), with: .color(.gray.opacity(0.25))) let color = away.contains(day) ? highlight : Color.gray.opacity(0.25) context.fill(Path(roundedRect: square, cornerRadius: 1.5), with: .color(color)) } } .frame(height: 60) .padding(.horizontal) } /// The days of the year — 0 is January 1 — on which a trip is under way. private var awayDays: Set<Int> { var days = Set<Int>() for trip in trips { let first = Calendar.current.dateComponents([.day], from: Date.on(year, 1, 1), to: trip.start).day! for night in 0..<trip.nights { days.insert(first + night) } } return days } /// How many days the year has: 365, or 366 in a leap year. private var daysInYear: Int { Calendar.current.range(of: .day, in: .year, for: Date.on(year, 1, 1))!.count }}struct YearGrid: View {
let trips: [Trip]
var year = 2027
@Environment(\.highlight) private var highlight
var body: some View {
Canvas { context, size in
let step = size.width / 53
let firstRow = Calendar.current.component(.weekday, from: Date.on(year, 1, 1)) - 1
let away = awayDays
for day in 0..<daysInYear {
let slot = day + firstRow
let square = CGRect(x: Double(slot / 7) * step, y: Double(slot % 7) * step,
width: step - 1.5, height: step - 1.5)
let color = away.contains(day) ? highlight : Color.gray.opacity(0.25)
context.fill(Path(roundedRect: square, cornerRadius: 1.5), with: .color(color))
}
}
.frame(height: 60)
.padding(.horizontal)
}
/// The days of the year — 0 is January 1 — on which a trip is under way.
private var awayDays: Set<Int> {
var days = Set<Int>()
for trip in trips {
let first = Calendar.current.dateComponents([.day], from: Date.on(year, 1, 1), to: trip.start).day!
for night in 0..<trip.nights {
days.insert(first + night)
}
}
return days
}
/// How many days the year has: 365, or 366 in a leap year.
private var daysInYear: Int {
Calendar.current.range(of: .day, in: .year, for: Date.on(year, 1, 1))!.count
}
}Run the app:
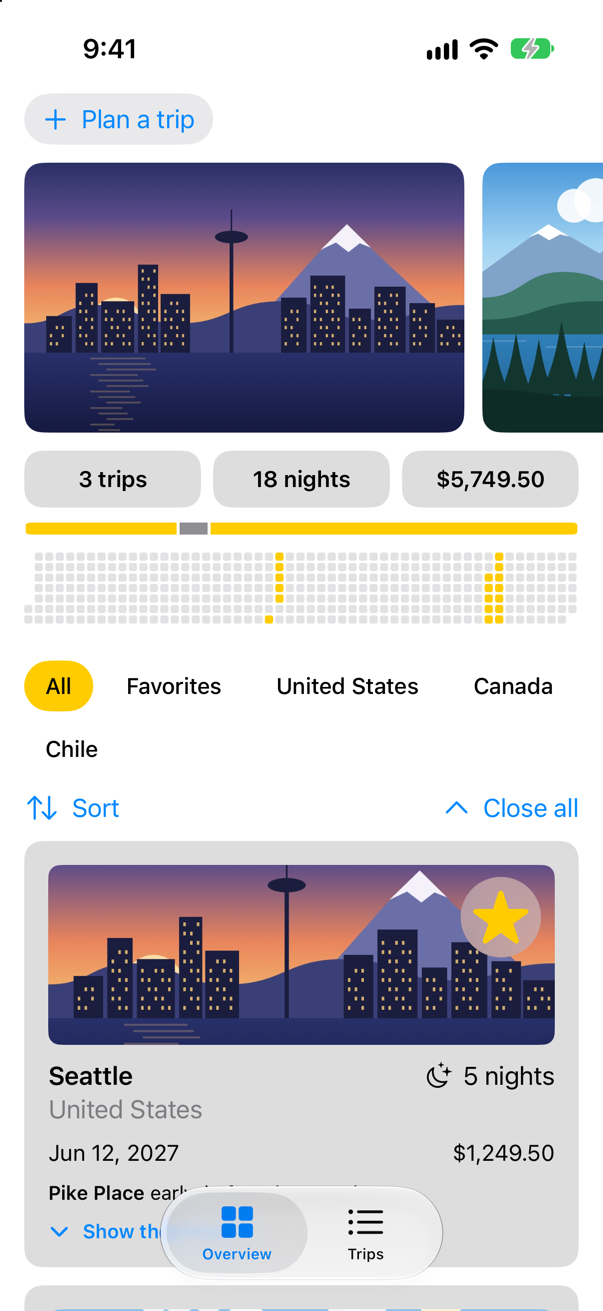
Six squares in June — Seattle's five days and Vancouver's one, side by side — and twelve in November for San Pedro de Atacama.
Words in a canvas
A canvas can draw text as well as shapes: context.draw(Text(…), at:anchor:) draws a Text at a point. The anchor says which part of the text sits on the point — by default its center; .topLeading puts its top left corner there. The month names go along the top, each over the column its first day falls in, and the squares move down to make room. In YearGrid.swift:
struct YearGrid: View { let trips: [Trip] var year = 2027 @Environment(\.highlight) private var highlight var body: some View { Canvas { context, size in let step = size.width / 53 let top = 16.0 let firstRow = Calendar.current.component(.weekday, from: Date.on(year, 1, 1)) - 1 for month in 1...12 { let day = Calendar.current.dateComponents([.day], from: Date.on(year, 1, 1), to: Date.on(year, month, 1)).day! let column = Double((day + firstRow) / 7) let name = Calendar.current.shortMonthSymbols[month - 1] context.draw(Text(name).font(.caption2).foregroundStyle(.secondary), at: CGPoint(x: column * step, y: 0), anchor: .topLeading) } let away = awayDays for day in 0..<daysInYear { let slot = day + firstRow let square = CGRect(x: Double(slot / 7) * step, y: Double(slot % 7) * step, let square = CGRect(x: Double(slot / 7) * step, y: top + Double(slot % 7) * step, width: step - 1.5, height: step - 1.5) let color = away.contains(day) ? highlight : Color.gray.opacity(0.25) context.fill(Path(roundedRect: square, cornerRadius: 1.5), with: .color(color)) } } .frame(height: 60) .frame(height: 70) .padding(.horizontal) } /// The days of the year — 0 is January 1 — on which a trip is under way. private var awayDays: Set<Int> { var days = Set<Int>() for trip in trips { let first = Calendar.current.dateComponents([.day], from: Date.on(year, 1, 1), to: trip.start).day! for night in 0..<trip.nights { days.insert(first + night) } } return days } /// How many days the year has: 365, or 366 in a leap year. private var daysInYear: Int { Calendar.current.range(of: .day, in: .year, for: Date.on(year, 1, 1))!.count }}struct YearGrid: View {
let trips: [Trip]
var year = 2027
@Environment(\.highlight) private var highlight
var body: some View {
Canvas { context, size in
let step = size.width / 53
let top = 16.0
let firstRow = Calendar.current.component(.weekday, from: Date.on(year, 1, 1)) - 1
for month in 1...12 {
let day = Calendar.current.dateComponents([.day], from: Date.on(year, 1, 1), to: Date.on(year, month, 1)).day!
let column = Double((day + firstRow) / 7)
let name = Calendar.current.shortMonthSymbols[month - 1]
context.draw(Text(name).font(.caption2).foregroundStyle(.secondary),
at: CGPoint(x: column * step, y: 0), anchor: .topLeading)
}
let away = awayDays
for day in 0..<daysInYear {
let slot = day + firstRow
let square = CGRect(x: Double(slot / 7) * step, y: top + Double(slot % 7) * step,
width: step - 1.5, height: step - 1.5)
let color = away.contains(day) ? highlight : Color.gray.opacity(0.25)
context.fill(Path(roundedRect: square, cornerRadius: 1.5), with: .color(color))
}
}
.frame(height: 70)
.padding(.horizontal)
}
/// The days of the year — 0 is January 1 — on which a trip is under way.
private var awayDays: Set<Int> {
var days = Set<Int>()
for trip in trips {
let first = Calendar.current.dateComponents([.day], from: Date.on(year, 1, 1), to: trip.start).day!
for night in 0..<trip.nights {
days.insert(first + night)
}
}
return days
}
/// How many days the year has: 365, or 366 in a leap year.
private var daysInYear: Int {
Calendar.current.range(of: .day, in: .year, for: Date.on(year, 1, 1))!.count
}
}Run the app:
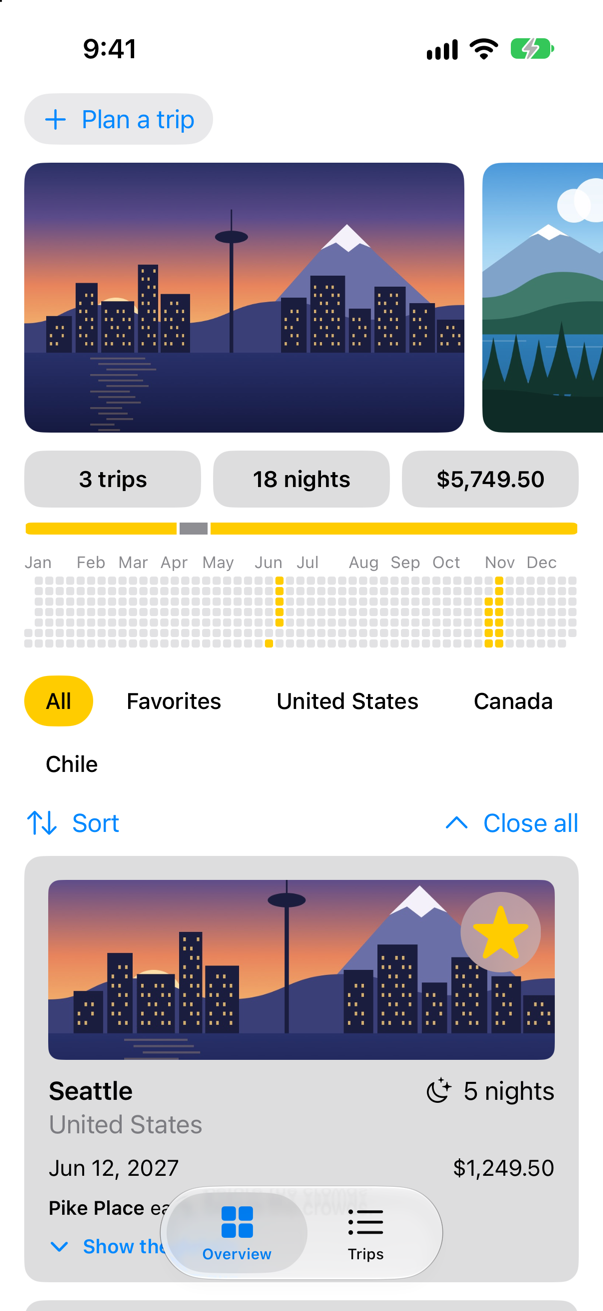
The months look like text. To VoiceOver they are not: drawn into a canvas, they are paint like the squares, and the screen reader finds nothing there to read — the run above read every piece of text on the screen, and no month was among them.
What VoiceOver hears
A picture that carries information needs words for people who cannot see it. The simplest is one label for the whole canvas, saying what a sighted person takes from it: the year, how many days away, and in which months. .accessibilityElement() makes the canvas one element, and .accessibilityLabel(_:) gives it the words, worked out from the same data as the squares. In YearGrid.swift:
struct YearGrid: View { let trips: [Trip] var year = 2027 @Environment(\.highlight) private var highlight var body: some View { Canvas { context, size in let step = size.width / 53 let top = 16.0 let firstRow = Calendar.current.component(.weekday, from: Date.on(year, 1, 1)) - 1 for month in 1...12 { let day = Calendar.current.dateComponents([.day], from: Date.on(year, 1, 1), to: Date.on(year, month, 1)).day! let column = Double((day + firstRow) / 7) let name = Calendar.current.shortMonthSymbols[month - 1] context.draw(Text(name).font(.caption2).foregroundStyle(.secondary), at: CGPoint(x: column * step, y: 0), anchor: .topLeading) } let away = awayDays for day in 0..<daysInYear { let slot = day + firstRow let square = CGRect(x: Double(slot / 7) * step, y: top + Double(slot % 7) * step, width: step - 1.5, height: step - 1.5) let color = away.contains(day) ? highlight : Color.gray.opacity(0.25) context.fill(Path(roundedRect: square, cornerRadius: 1.5), with: .color(color)) } } .frame(height: 70) .padding(.horizontal) .accessibilityElement() .accessibilityLabel(summary) } /// The days of the year — 0 is January 1 — on which a trip is under way. private var awayDays: Set<Int> { var days = Set<Int>() for trip in trips { let first = Calendar.current.dateComponents([.day], from: Date.on(year, 1, 1), to: trip.start).day! for night in 0..<trip.nights { days.insert(first + night) } } return days } /// What VoiceOver reads for the whole grid: the year, the days away, and the months they fall in. private var summary: String { var months: [String] = [] for day in awayDays.sorted() { let date = Calendar.current.date(byAdding: .day, value: day, to: Date.on(year, 1, 1))! let name = date.formatted(.dateTime.month(.wide)) if !months.contains(name) { months.append(name) } } let days = awayDays.count == 1 ? "1 day" : "\(awayDays.count) days" return "\(year): \(days) away, in \(months.formatted())" } /// How many days the year has: 365, or 366 in a leap year. private var daysInYear: Int { Calendar.current.range(of: .day, in: .year, for: Date.on(year, 1, 1))!.count }}struct YearGrid: View {
let trips: [Trip]
var year = 2027
@Environment(\.highlight) private var highlight
var body: some View {
Canvas { context, size in
let step = size.width / 53
let top = 16.0
let firstRow = Calendar.current.component(.weekday, from: Date.on(year, 1, 1)) - 1
for month in 1...12 {
let day = Calendar.current.dateComponents([.day], from: Date.on(year, 1, 1), to: Date.on(year, month, 1)).day!
let column = Double((day + firstRow) / 7)
let name = Calendar.current.shortMonthSymbols[month - 1]
context.draw(Text(name).font(.caption2).foregroundStyle(.secondary),
at: CGPoint(x: column * step, y: 0), anchor: .topLeading)
}
let away = awayDays
for day in 0..<daysInYear {
let slot = day + firstRow
let square = CGRect(x: Double(slot / 7) * step, y: top + Double(slot % 7) * step,
width: step - 1.5, height: step - 1.5)
let color = away.contains(day) ? highlight : Color.gray.opacity(0.25)
context.fill(Path(roundedRect: square, cornerRadius: 1.5), with: .color(color))
}
}
.frame(height: 70)
.padding(.horizontal)
.accessibilityElement()
.accessibilityLabel(summary)
}
/// The days of the year — 0 is January 1 — on which a trip is under way.
private var awayDays: Set<Int> {
var days = Set<Int>()
for trip in trips {
let first = Calendar.current.dateComponents([.day], from: Date.on(year, 1, 1), to: trip.start).day!
for night in 0..<trip.nights {
days.insert(first + night)
}
}
return days
}
/// What VoiceOver reads for the whole grid: the year, the days away, and the months they fall in.
private var summary: String {
var months: [String] = []
for day in awayDays.sorted() {
let date = Calendar.current.date(byAdding: .day, value: day, to: Date.on(year, 1, 1))!
let name = date.formatted(.dateTime.month(.wide))
if !months.contains(name) {
months.append(name)
}
}
let days = awayDays.count == 1 ? "1 day" : "\(awayDays.count) days"
return "\(year): \(days) away, in \(months.formatted())"
}
/// How many days the year has: 365, or 366 in a leap year.
private var daysInYear: Int {
Calendar.current.range(of: .day, in: .year, for: Date.on(year, 1, 1))!.count
}
}Run the app:
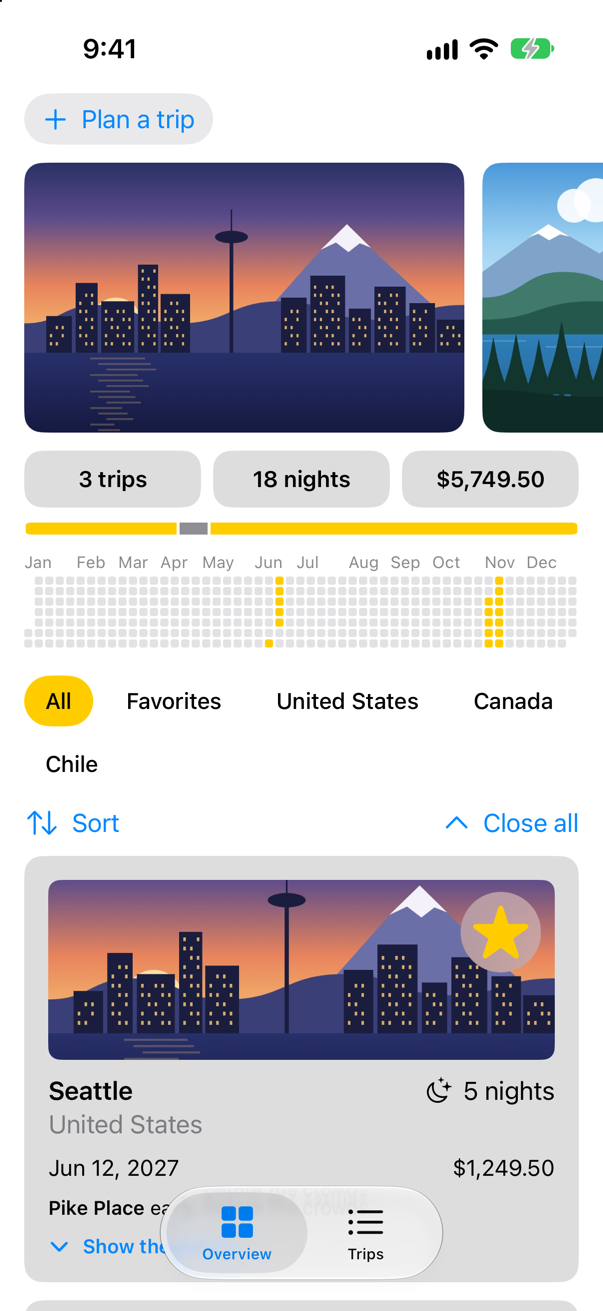
The picture did not change; what changed is underneath. VoiceOver now finds one element where the grid is, and reads "2027: 18 days away, in June and November". For a chart whose individual values matter, accessibilityChildren can give a canvas a separate element for each bar or point — an edge case in this lesson.
What you built
- A
YearGriddrawn in oneCanvas: a rounded square for each day of 2027, laid out by week. - The days away worked out once and filled in the highlight color.
- Month names drawn into the canvas with
context.draw(_:at:anchor:). - An accessibility label for the whole canvas, built from the same data.
Next, animation: change the state and let SwiftUI animate the difference — the ring and the ticket will move.
The finished project
Stuck, or want to compare with your own? This is the project as it stands at the end of this lesson, built and run before it was put here.
- Trips-lesson-27.zip — unzip it, then open
Trips.xcodeprojin Xcode.
Flash cards
18 cards for this lesson, each labelled with its topic. 10 ask how you would write something; the other 8 are trick questions, written to catch a misunderstanding. Answer in your head first, then tap the card.
Syntax · CanvasDraw a filled circle in a canvas.
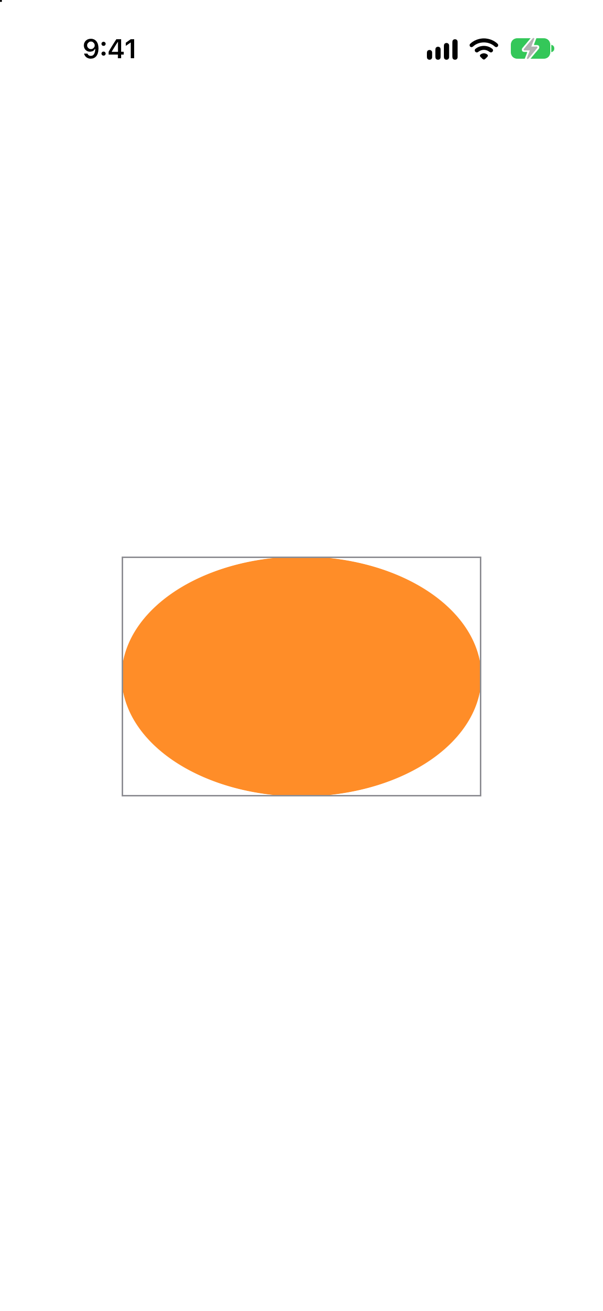
Canvas { context, size in … } and context.fill(_:with:), given a Path and a shading such as .color(_:). The closure is handed the canvas's size, so the ellipse fills the frame (the gray border).
Syntax · CanvasDraw the outline of a path in a canvas.
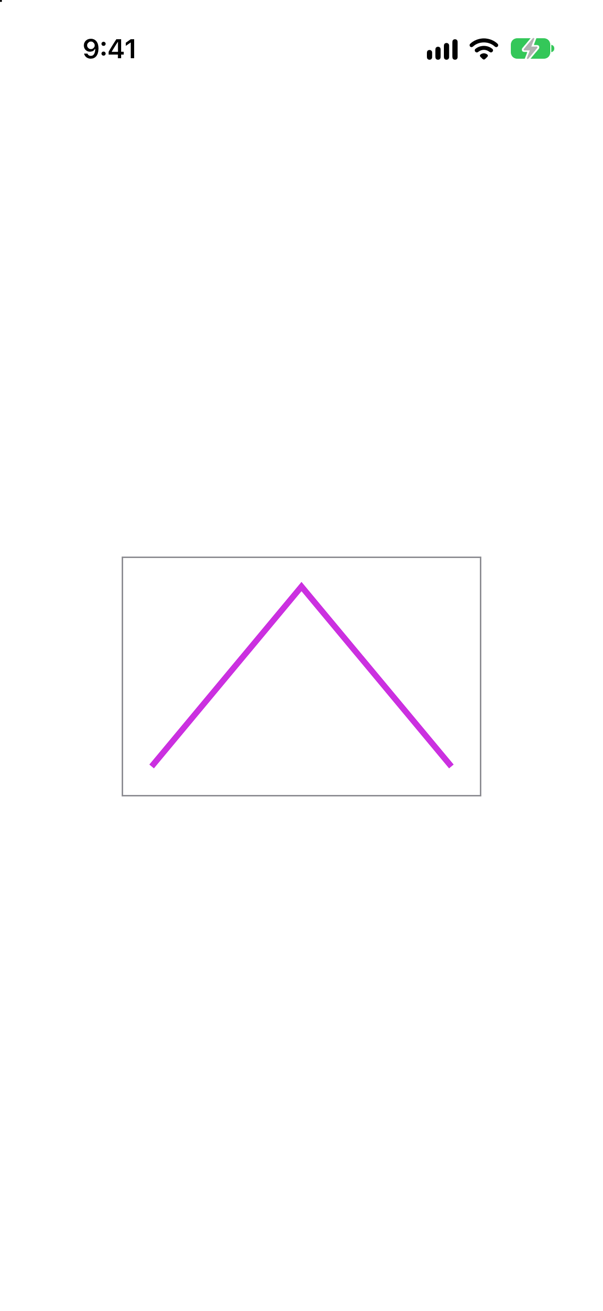
context.stroke(_:with:lineWidth:) — or style: with a StrokeStyle for dashes and caps, as with shapes.
Syntax · CanvasDraw text at a point in a canvas, with its leading edge on the point.
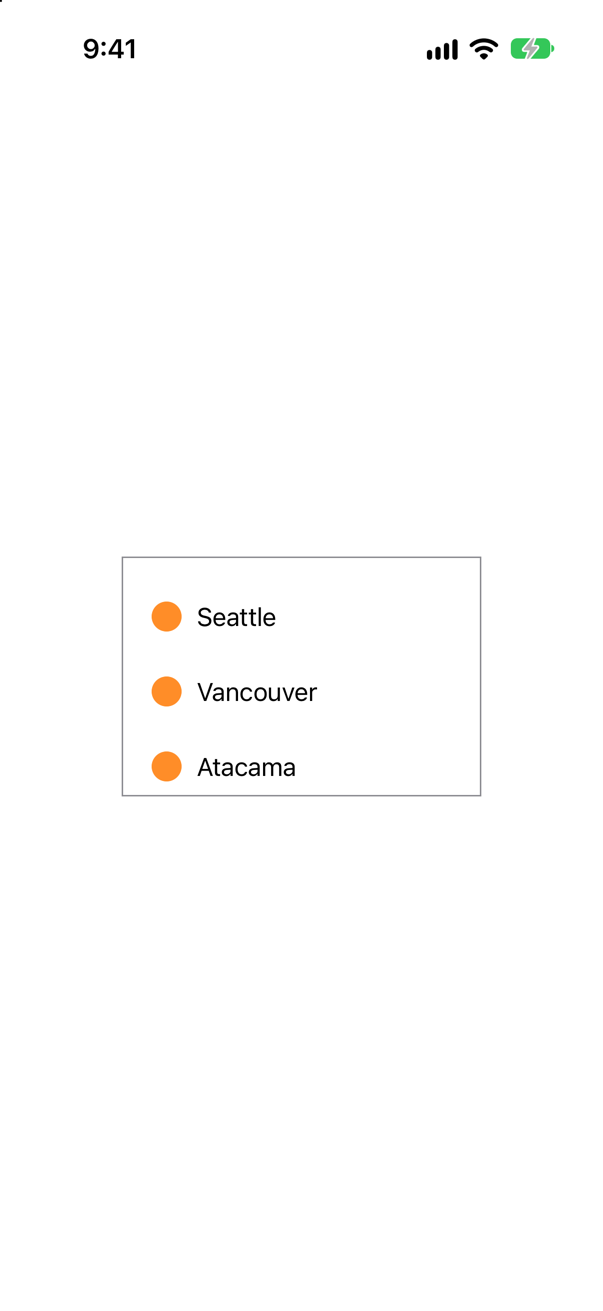
context.draw(_:at:anchor:) with a Text. The anchor is the part of the text placed on the point; without one, the text is centered on it.
Syntax · CanvasDraw an SF Symbol in a canvas.

context.resolve(_:) turns an Image (or a Text) into a resolved one, ready to draw — resolve once and draw it many times. It takes the canvas's environment, so .font sizes the symbol.
Syntax · CanvasMove and turn everything drawn after this point in a canvas.
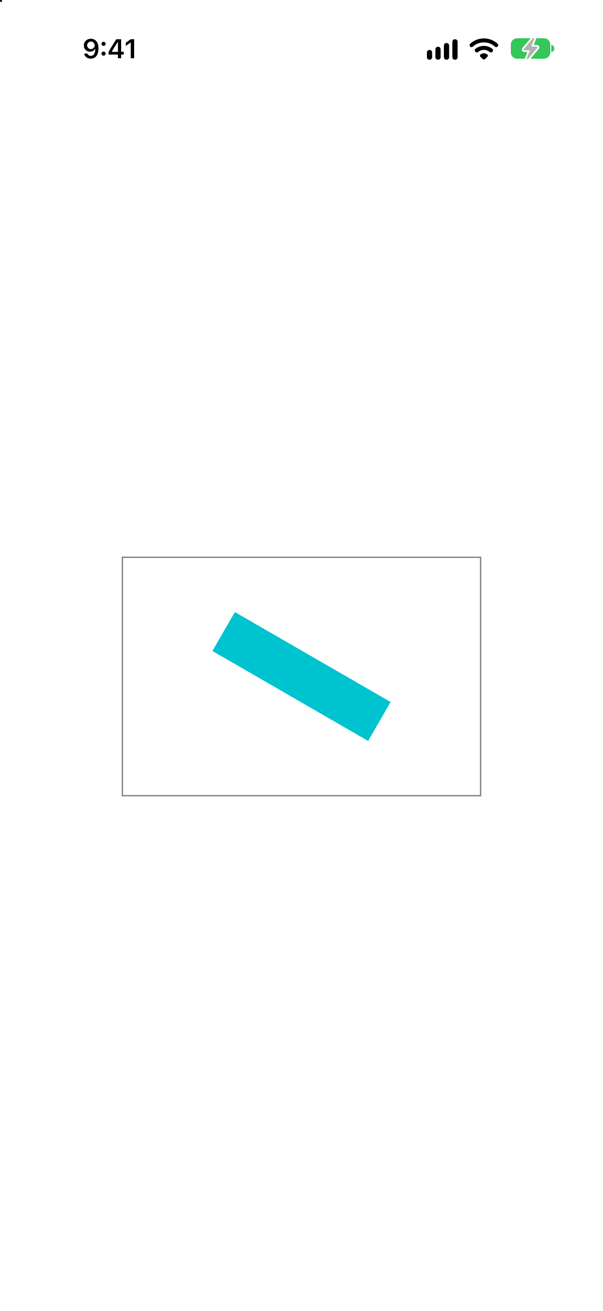
translateBy(x:y:), rotate(by:) and scaleBy(x:y:) change the context's transform, which applies to everything drawn afterwards. Here the origin moved to the middle, so the bar is drawn around (0, 0) and turns about its center.
Syntax · CanvasLet only part of the canvas be drawn on.
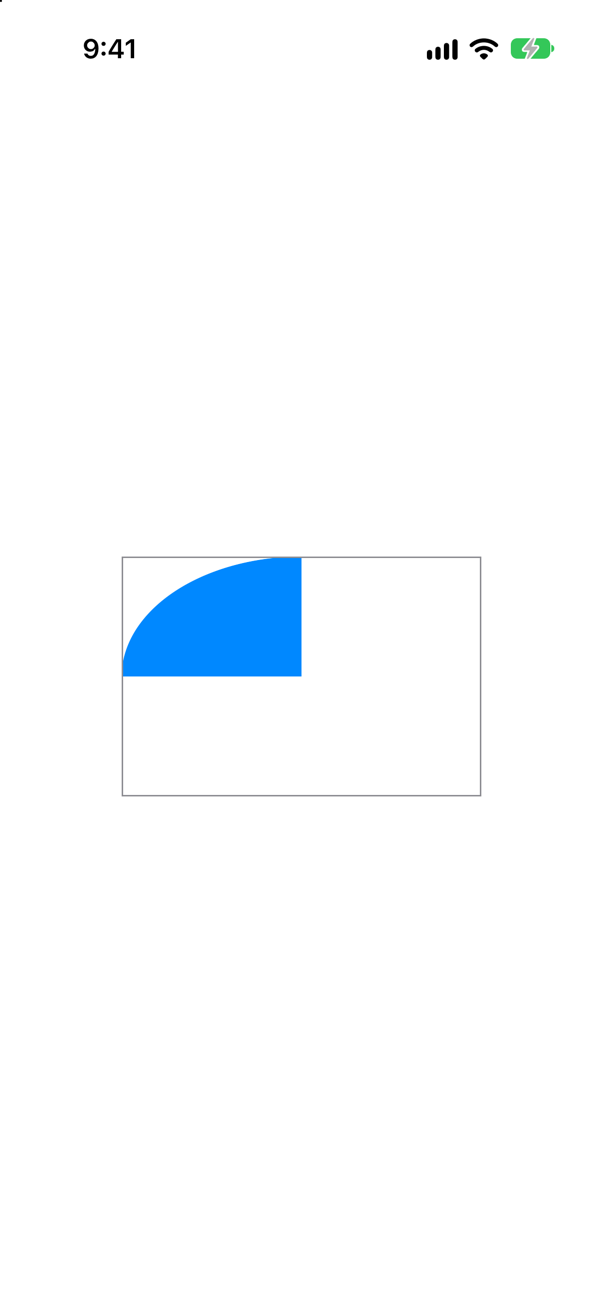
context.clip(to:): later drawing appears only inside the path. Order matters — a clip affects what is drawn after it.
Syntax · CanvasDraw a SwiftUI view inside a canvas, many times.

A symbols: closure of tagged views, and context.resolveSymbol(id:) to draw one. The view is rendered as a picture — it does not answer taps or reach VoiceOver.
Syntax · CanvasKnow where in a canvas the user tapped.

.onTapGesture { location in … } hands you the point, in the canvas's own coordinates. Which thing was tapped is yours to work out — the console said tapped at 201 375.
Syntax · CanvasRedraw a canvas on every frame, to animate it.

TimelineView(.animation) redraws its content as often as the display does, handing it timeline.date; the canvas draws from that date. The picture is one moment of a bar that turns once every four seconds.
Syntax · CanvasGive a canvas one label for VoiceOver.
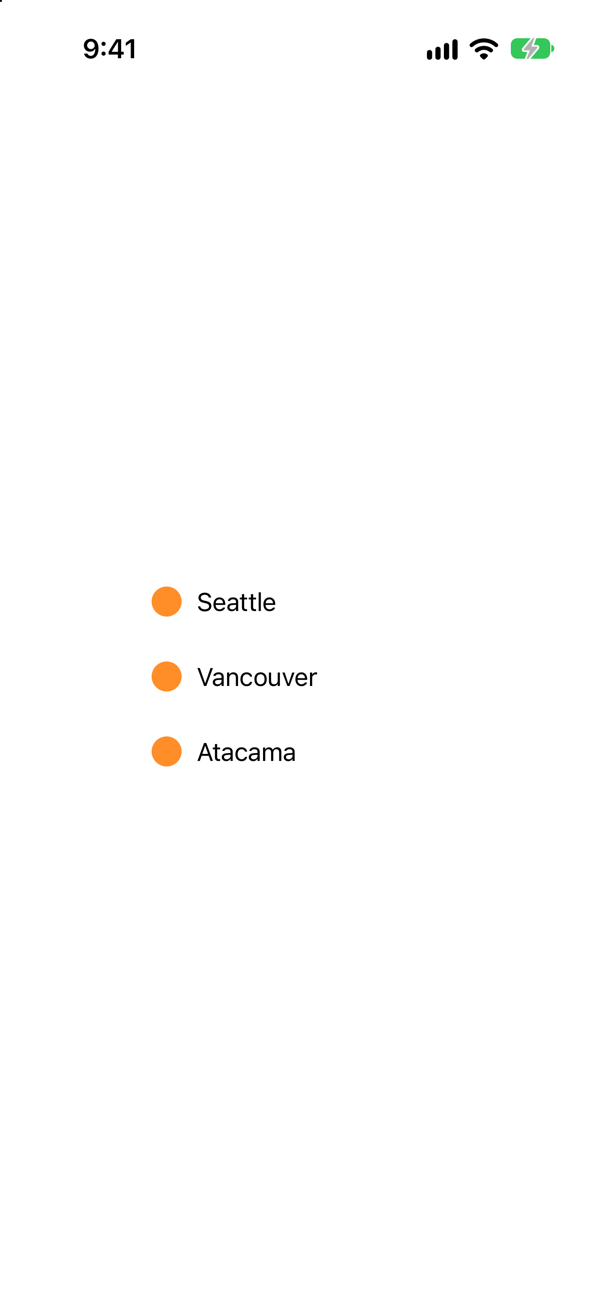
.accessibilityElement() and .accessibilityLabel(_:) on the canvas: one element that says what the drawing shows. Nothing drawn inside a canvas is read otherwise.
Trick question · CanvasA canvas draws three dots and, beside them, Text("Seattle"), Text("Vancouver") and Text("Atacama"). What does VoiceOver read?
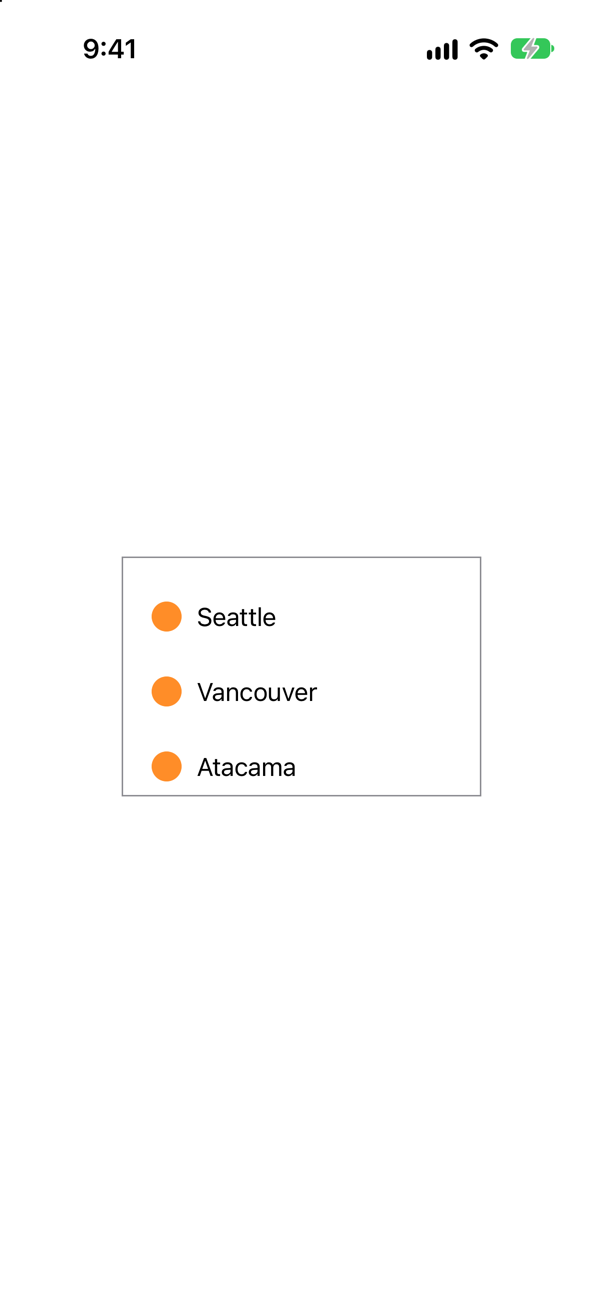
Nothing. Drawn into a canvas, text is paint. Apple: "A canvas doesn’t offer interactivity or accessibility for individual elements." Give the canvas a label, or accessibilityChildren.
Trick question · CanvasIn a canvas, context.fill draws a circle, and then context.clip(to:) clips to the top left quarter. How much of the circle shows?
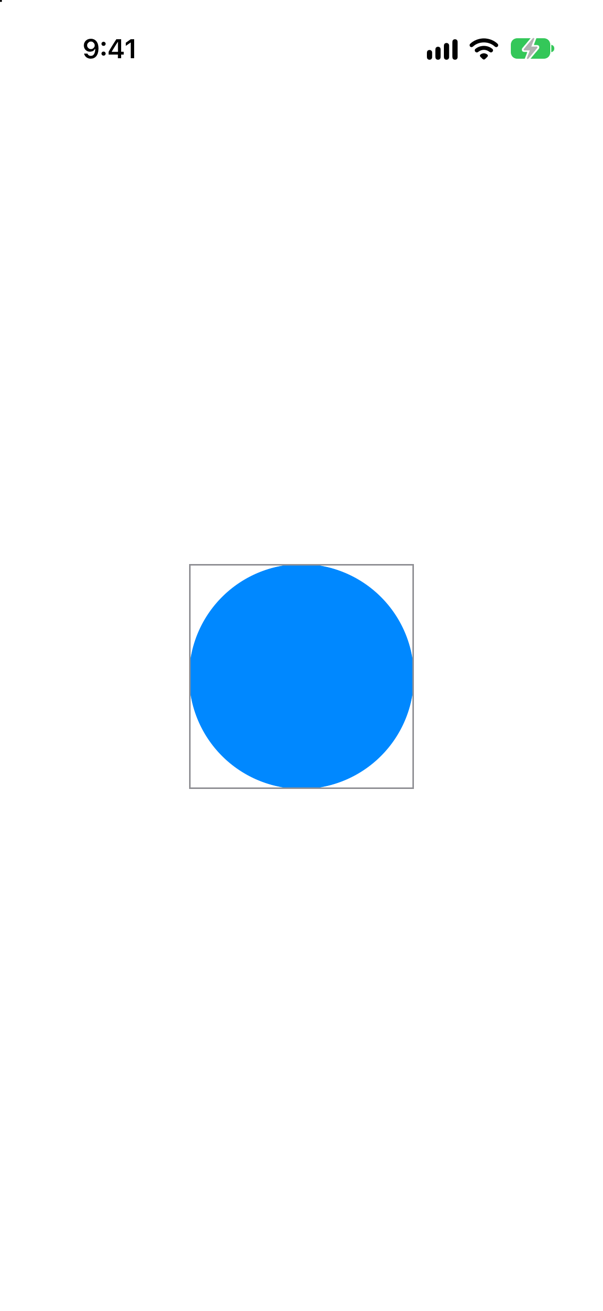
All of it. A context's state — clip, transform, opacity — applies to later drawing. Apple: if the fill comes first, "the mask doesn’t affect the ellipse." Clip first to get a quarter.
Trick question · Canvascontext.draw(Text("Seattle"), at: point), with no anchor. Where is the text, relative to the point?

Centered on it — the red dot is in the middle of the word. The default anchor is .center; pass anchor: .leading or .topLeading to hang text from a point, as the year grid's months are.
Trick question · CanvasA Canvas with no frame sits in a VStack between two texts. How big is it?
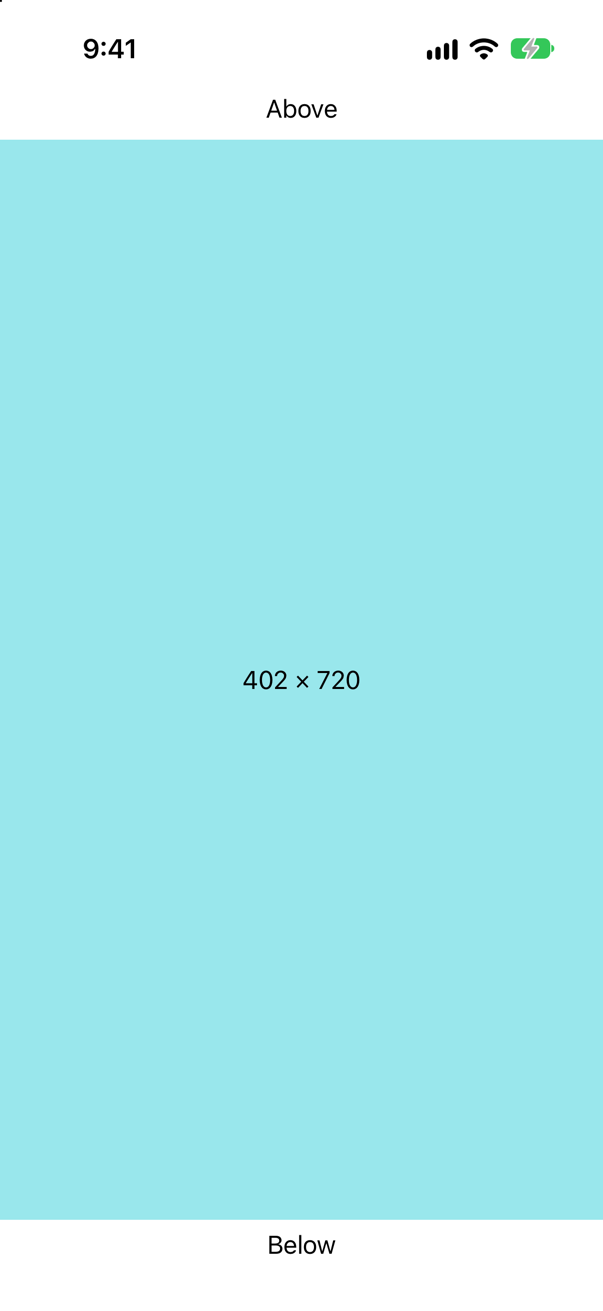
All the room there is — the picture prints the size it was given. Like a shape, a canvas takes the space it is offered; give it a frame, as the year grid has.
Trick question · CanvasA canvas draws count circles, and a button below it does count += 1. The button is tapped twice. Does the canvas change?
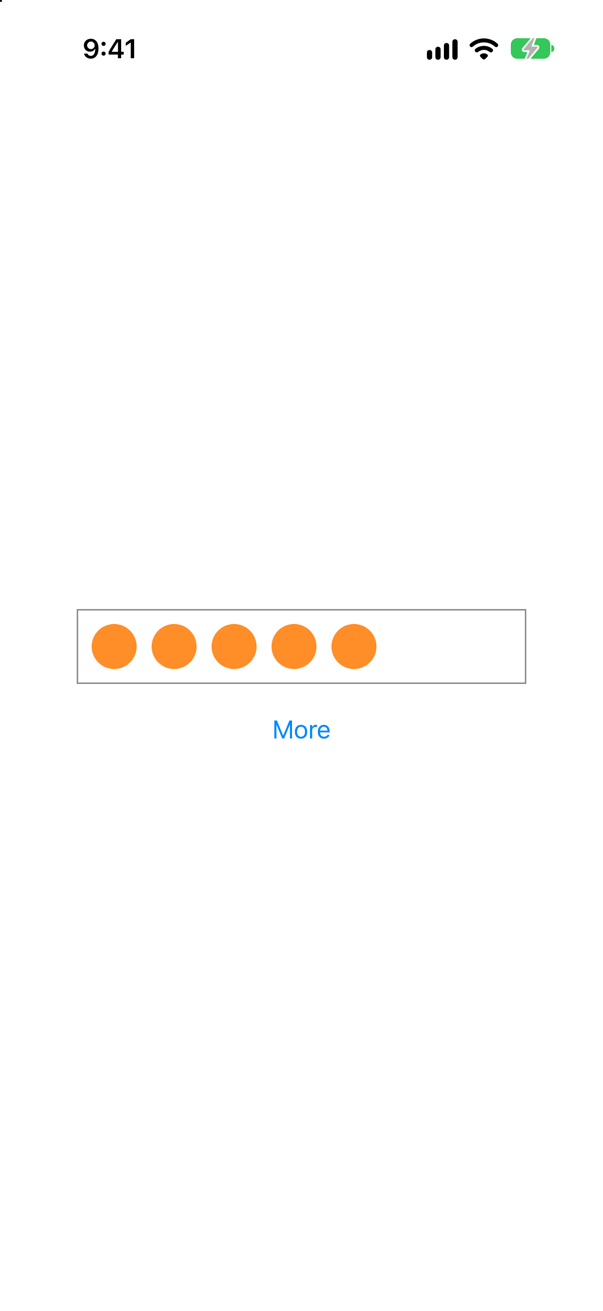
Yes — five circles. The drawing closure reads count, so when count changes SwiftUI draws the canvas again, as it would run any body that read it. A canvas is part of the state-driven system, not outside it.
Trick question · CanvasA Button is passed to a canvas as a symbol and drawn five times. Can any of the five be tapped?

No. A symbol is drawn as a picture of the view: there is no button on the screen to tap, and VoiceOver finds none. Apple: a canvas gives no interactivity or accessibility "including for views that you pass in as symbols".
Trick question · Textlet year = 2027 and Text("Trips in \(year)"). What appears on the screen?
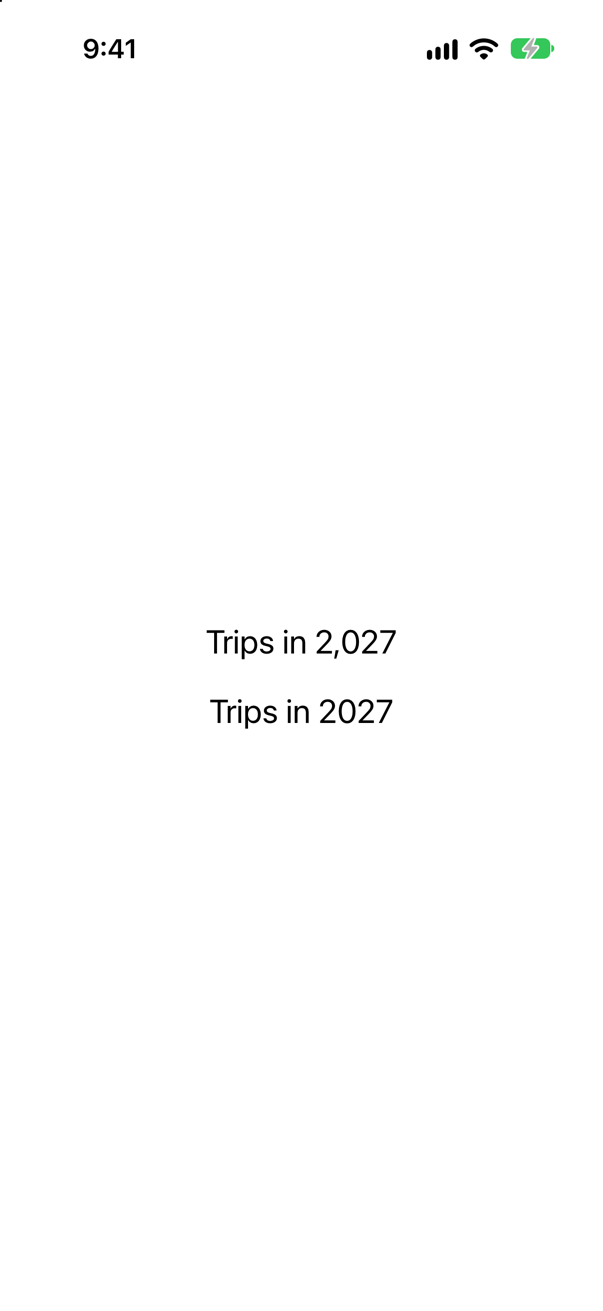
"Trips in 2,027" (the first line). A string literal in Text is a localized key, and an Int put into one is formatted as a number, thousands separator and all. Interpolate String(year), use Text(verbatim:), or a format without grouping.
Trick question · Canvasvar copy = context, then copy.clip(to:) the left half and copy.fill an ellipse; then context.fill a rectangle on the right. Is the rectangle clipped?
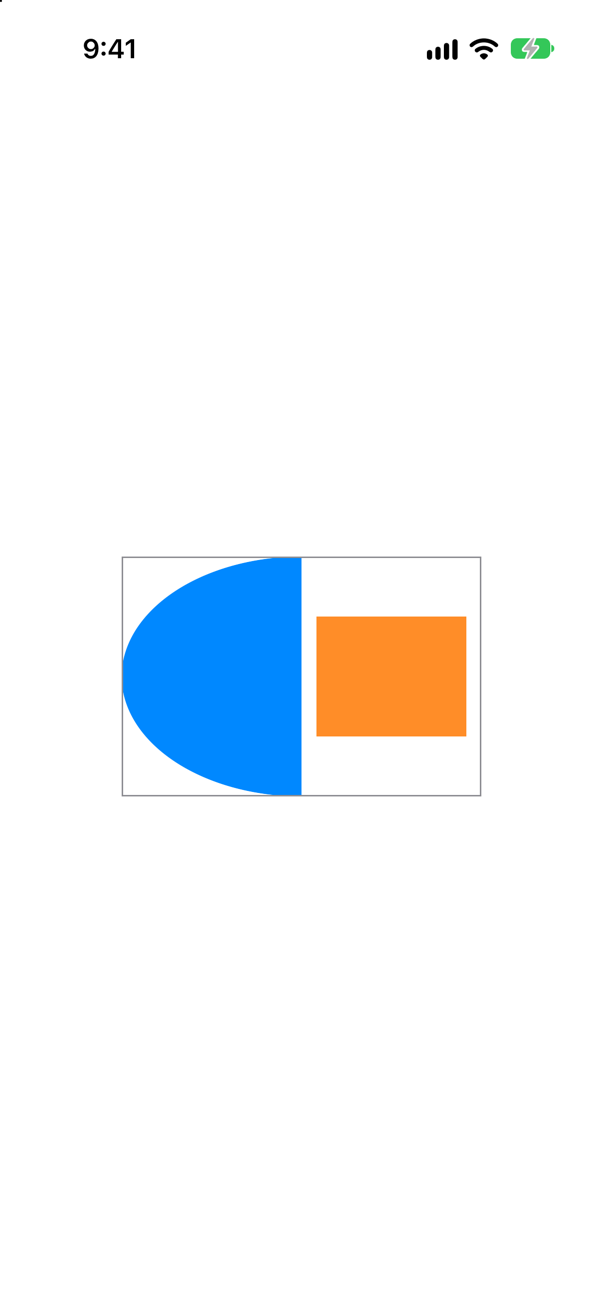
No. GraphicsContext is a struct: the copy has its own state, so its clip cut the ellipse in half and left the original context — and the orange rectangle — alone. It is the standard way to change settings for one part of a drawing.
Edge cases and tricky questions
10 questions of the kind an interviewer uses to find out whether you really know this — the corners, the traps, and the things that changed recently. Each has its source. Wherever the answer is what some code does, that code was compiled and run, and what you see under “Show the answer” is what it really did. Say your answer aloud before you open it.
A canvas draws three orange dots, each with a city name beside it in Text. What can VoiceOver read in it — and what is the least you should add?
Show the answer
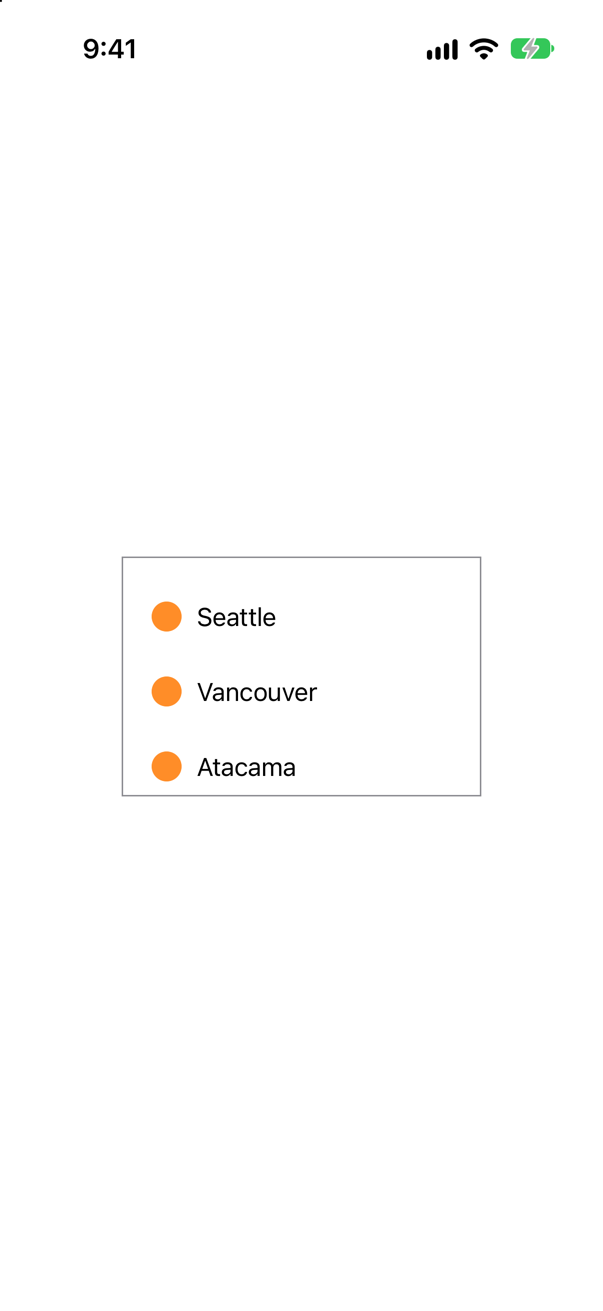
Nothing. The reading found no text and no image: the words are paint. Apple: "A canvas doesn’t offer interactivity or accessibility for individual elements, including for views that you pass in as symbols." The least you owe a VoiceOver user is one element with a label that says what the picture says:
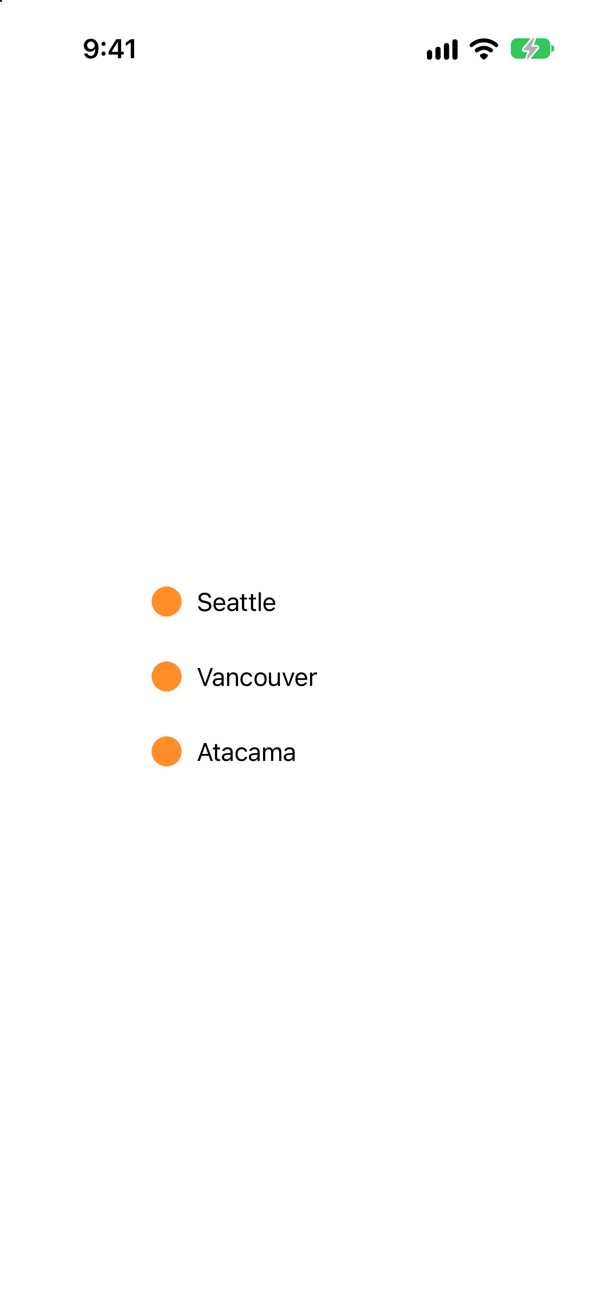
Now the screen reader finds one element where the canvas is, and reads the sentence. It is what this lesson's year grid does. When the individual values matter — a chart someone will want to explore — the next question goes further.
Where this comes from: Canvas — Measured on iOS 27: the accessibility reading found no text and no image inside the canvas.
A canvas draws a bar for each stay — Seattle 5 nights, Vancouver 1, Atacama 12. How can VoiceOver move from bar to bar, as it would through a list of views?
Show the answer
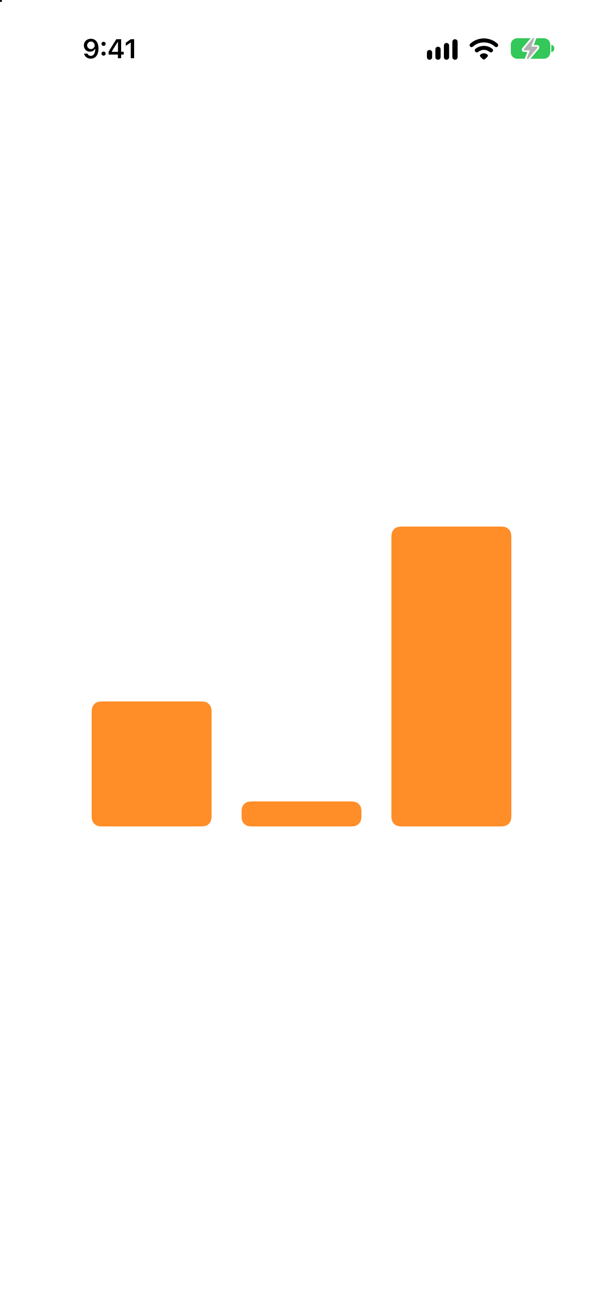
Give the canvas accessibility children. .accessibilityChildren { … } takes ordinary views, never drawn, whose accessibility elements become the canvas's children: here a hidden HStack of three rectangles, each labelled with its city and valued with its nights. The driver found an element called Seattle and one called Atacama where the bars are.
Apple's page for the modifier uses exactly this case: "a Canvas displays a graph of vertical bars that don’t have any inherent accessibility elements. You make the view accessible by adding the accessibilityChildren(children:) modifier with views whose accessibility elements represent the values of each bar drawn in the canvas" — and "SwiftUI hides any views that you provide with the children parameter." The layout of the hidden views decides where each element is, so lay them out like the bars.
Where this comes from: accessibilityChildren(children:) · Canvas — Measured on iOS 27: elements labelled Seattle and Atacama were found over the canvas.
Two canvases draw a circle and clip to the top left quarter. One clips first, the other fills first. What does each show?
Show the answer
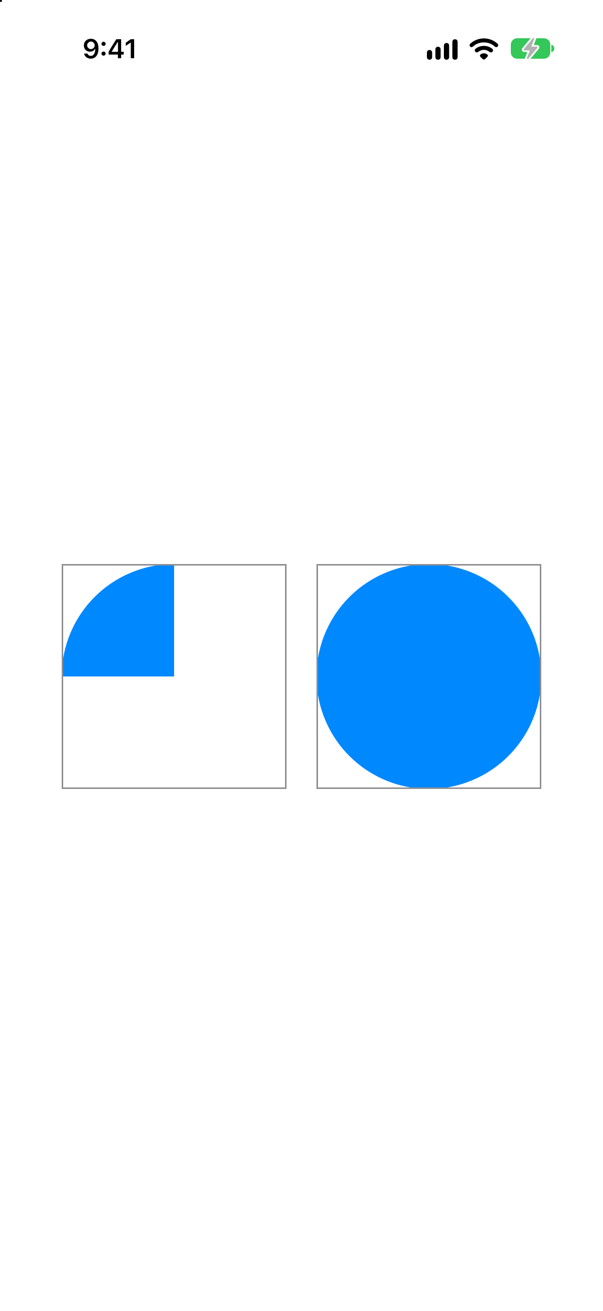
Clip first gives a quarter; fill first gives the whole circle. A graphics context is a drawing surface and its current settings — clip, transform, opacity, blend mode, filters — and each setting applies to the drawing that comes after it. Apple: "The order of operations matters. Changes that you make to the state of the context, like adding a mask or a filter, apply to later drawing operations."
It is the opposite of SwiftUI's modifiers, where .clipShape applies to the view it wraps whenever it is written. In a canvas, you set first and draw second — exactly as in Core Graphics.
Where this comes from: GraphicsContext — Apple, GraphicsContext: "If you reverse the fill and clip operations in the example above, so that the fill comes first, the mask doesn’t affect the ellipse."
Settings changed for one part of a drawing should not leak into the rest. In a canvas, var copy = context; the copy is clipped to the left half and fills an ellipse; then the original fills a rectangle on the right. Is the rectangle clipped?
Show the answer
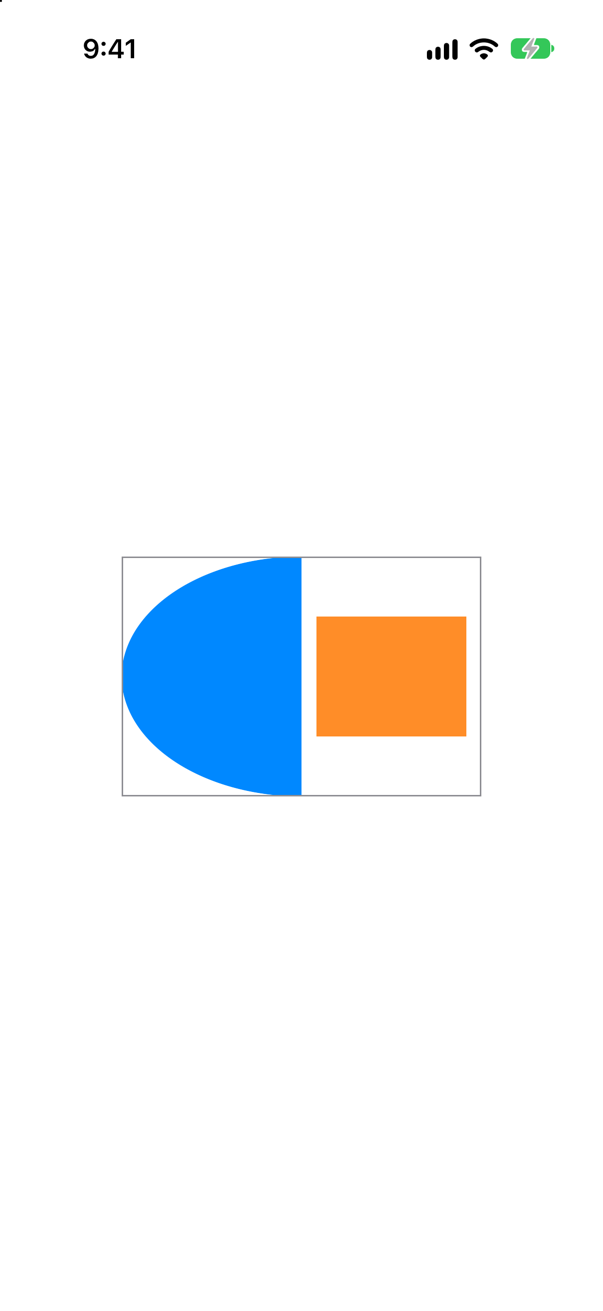
No. GraphicsContext is a value type: var copy = context is a second set of settings drawing onto the same surface. The clip belongs to the copy, so it halved the ellipse, and the original context drew the orange rectangle unclipped. Apple: "You can modify the state of one context without affecting the state of any other, even if they refer to the same layer."
Where Core Graphics has saveGState and restoreGState, a canvas has copies: make one for each part that needs its own transform, opacity or clip, and let it go out of scope.
Where this comes from: GraphicsContext — Measured on an iPhone 17 simulator.
A canvas draws three cities as circles across its width, and has .onTapGesture. How does the code know which city was tapped?
Show the answer
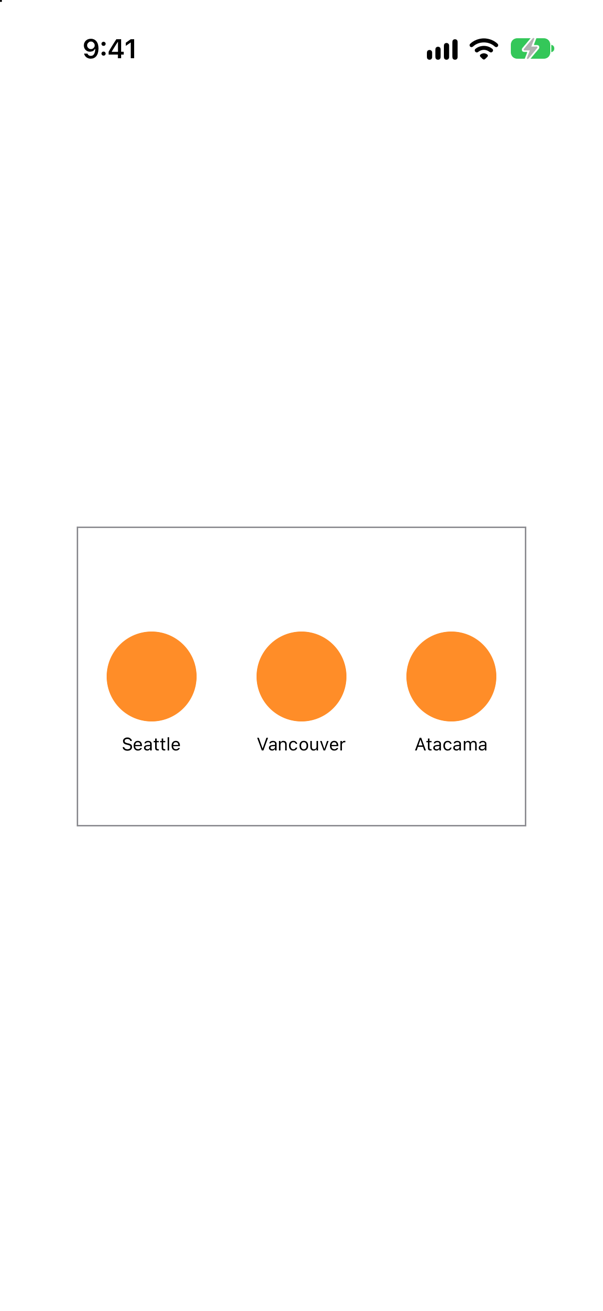
By doing the arithmetic itself. The gesture hands over only a point, in the canvas's coordinates, and no element under it — there are no elements. Dividing the point's x by the width of a column gives the index; a tap in the middle printed:
tapped VancouverThat is the price of a canvas for anything interactive: you redo the hit testing that views give for free, and it must match the drawing exactly (here both use the same 300-point width). When most things on a screen must be tapped, views are usually the better choice; a canvas suits pictures that are looked at.
Where this comes from: Canvas — Measured on iOS 27: the tap in the middle of the canvas printed "tapped Vancouver".
The year grid's label says "2027". Drawn as Text("Trips in \(year)"), with let year = 2027, what appears? And with Text(verbatim:), String(year), or a format with no grouping?
Show the answer
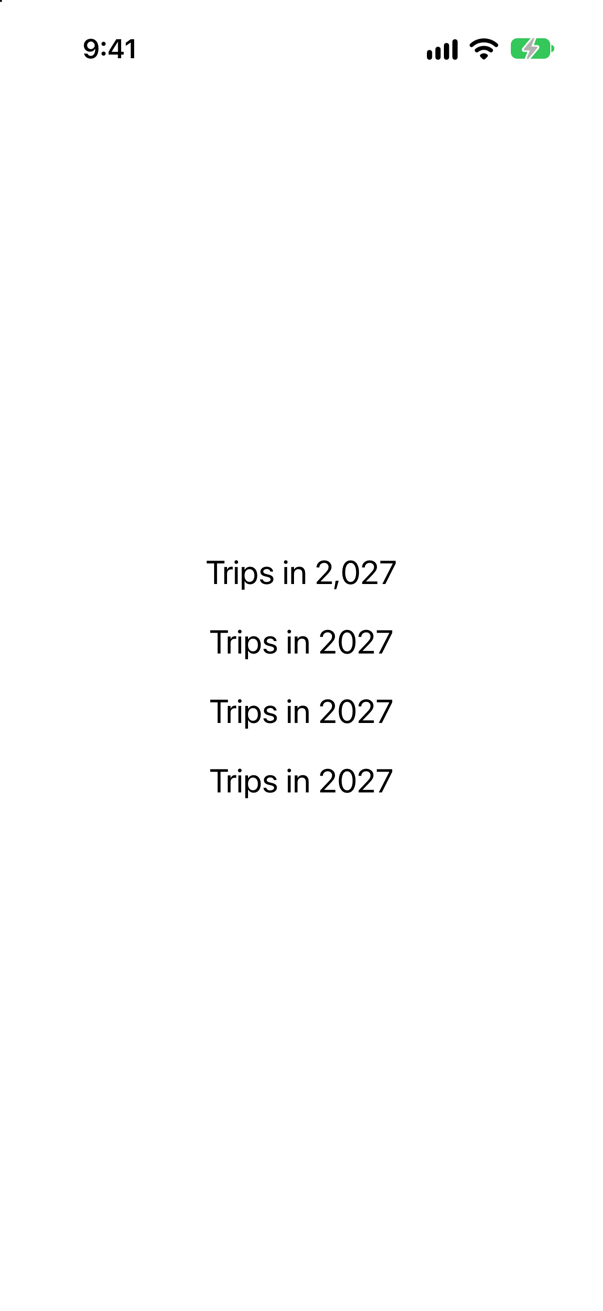
"Trips in 2,027" — and "2027" for the other three. A string literal in Text(...) is a LocalizedStringKey, and a number interpolated into one is formatted for the reader's locale, with a thousands separator. A year is not that kind of number.
Three ways out: Text(verbatim:), which takes the string as it is (and is not translated); interpolating a String, which goes in untouched; or a format that says what you mean, format: .number.grouping(.never). This lesson's grid draws its months from the calendar and puts the year only into a String for VoiceOver — Swift's own string interpolation does not group digits.
Where this comes from: Text · LocalizedStringKey — Measured on an iPhone 17 simulator with the English (US) region.
A canvas fills the screen and prints its size in its middle. The phone is turned sideways. Does the canvas notice?
Show the answer

Yes. When the canvas's size changes, SwiftUI calls the drawing closure again with the new size, and everything drawn from size follows. The two pictures show two different sizes printed by the same closure.
So draw from size, never from fixed numbers — the same rule as a shape's path(in:). A canvas is also drawn again whenever state it reads changes (a flash card shows a counter), so keep the closure fast: work that does not depend on the size or the state belongs outside it.
Where this comes from: Canvas — Measured on an iPhone 17 simulator, upright and turned to landscape.
Another way to make many views cheap to draw is .drawingGroup(), which renders them into one image. Three Text views in a VStack with .drawingGroup() — can VoiceOver still read them?
Show the answer
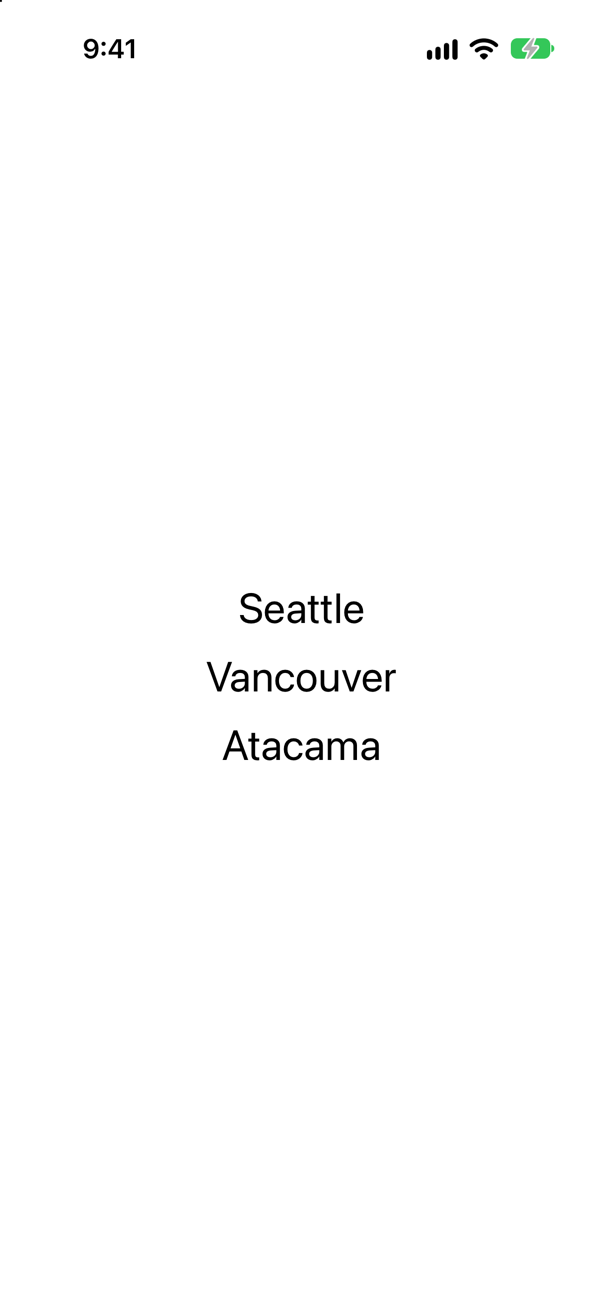
Yes — all three. drawingGroup() changes how views are drawn — Apple: it "flattens a subtree of views into a single view before rendering it" — but they are still views, with their layout, their state and their accessibility elements. The reading found all three texts.
So the choice is not only about speed. A canvas draws without views at all: the cheapest, but no accessibility or interaction unless you add them. drawingGroup keeps the views and flattens their drawing, which helps when many layered views are slow to composite. Apple warns that it only includes "views that SwiftUI rasterizes directly using its own drawing primitives" — complex controls and UIKit views appear as placeholders.
Where this comes from: drawingGroup(opaque:colorMode:) · Canvas — Measured on iOS 27: the accessibility reading found the three texts under drawingGroup().
In a canvas, a city name should sit on a rounded label exactly as wide as the text. How do you find out how big the text will be?
Show the answer

Resolve it, then measure it. context.resolve(_:) turns a Text into a GraphicsContext.ResolvedText — styled with the canvas's environment, ready to draw — and measure(in:) says how much room it needs within a given size. The capsule is drawn from that size, then the text on top of it.
Resolving once and reusing it also saves work when the same text is drawn many times: draw with a resolved text skips styling it again. The same goes for images with resolve(_:) on an Image.
Where this comes from: GraphicsContext — Measured on an iPhone 17 simulator.
A Button is passed to a canvas in symbols: and drawn five times. Are there five buttons on the screen?
Show the answer

None. The reading found no button, and a tap on one printed nothing. A symbol is rendered once into a picture, and the canvas draws that picture where you ask — the button's look, without the button. Apple says so of every symbol: no "interactivity or accessibility for individual elements, including for views that you pass in as symbols."
Symbols are for drawing a complex view many times cheaply — a map pin, a custom marker. For anything to press, put real views over the canvas, in an overlay or a ZStack.
Where this comes from: Canvas — Measured on iOS 27: no buttons were found, and a tap printed nothing.